Monitoring
Monitoring is the runtime operations and observability surface for a single PADAS Core: operators watch live data movement across streams, tasks, sources, and sinks, and pivot into stream diagnostics, live event inspection, PDL querying, and system telemetry without leaving one workspace. It replaces separate Streams-only and Core-only monitoring pages—this is the unified streaming operations console for pipeline health, throughput analysis, and incident response.
The UI combines live telemetry with event visibility: tables expose EPS, drops, and latency; Query and Monitor open runtime stream tooling; the metrics tab charts resource saturation and backpressure-related signals. Together they read like a Kafka-style stream observability layer paired with SIEM-grade runtime diagnostics—grounded in production troubleshooting, not a passive dashboard.
Runtime scope
| Rule | Operational detail |
|---|---|
| Core-local metrics | Every number and row reflects the selected Core only—runtime telemetry is not normalized across engines. |
| Live engine behavior | Readouts come from the running Core’s APIs; Monitoring shows runtime state, not registry intent. |
| Per-Core variance | Throughput, drops, and EPS can differ sharply between Cores; switch the selector to compare—there is no cluster-wide aggregation. |
| No merged topology intent | Graph placement and definitions remain authoritative under Pipelines (registry intent) and Management → Pipelines (assign/deploy); this page answers what is happening now on disk and wire. |
Monitoring workspace
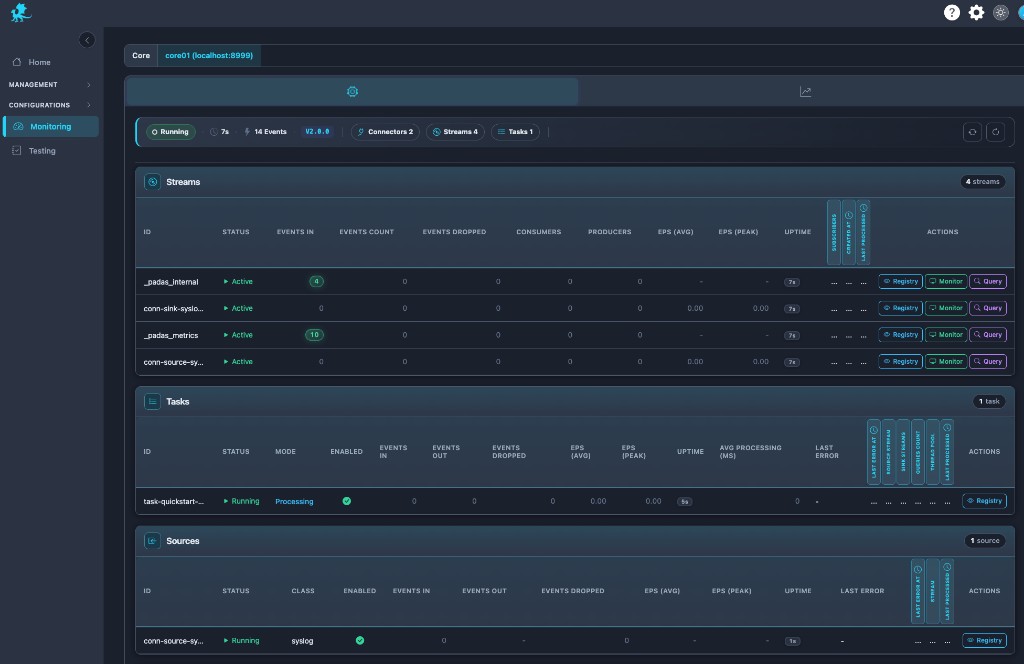
The workspace is a single operational monitoring surface: Streams, Tasks, Sources, and Sinks share one scrollable context so runtime bottlenecks surface faster—ingress pressure, stream congestion, task lag, and sink stalls appear side by side.
- Unified topology visibility — User pipelines and internal streams (metrics, internal, and similar) sit in the same Streams lens so platform runtime observability is visible next to business event flow.
- Core ribbon — Status, uptime, aggregate event volume, engine version, and counts (connectors, streams, tasks) give a pipeline health pulse before you drill into rows.
- Pivot without navigation — Toggle from component tables to the system telemetry view to correlate throughput swings with CPU, memory, and internal counters.
Streams visibility
Streams are the backbone of stream diagnostics: each row shows event flow health—rates, drops, subscriber geometry, and uptime—so downstream pressure and routing mistakes stand out.
- Internal streams — Platform channels appear alongside application streams; they matter for metrics fan-out, control traffic, and explaining “missing” volume during deep dives.
- Producers / consumers — Seeing who publishes and subscribes helps debug stalled consumers, orphaned sinks, or tasks not attached to the stream you expected.
- Congestion signals — Rising dropped events, flattening EPS, or widening ingress vs egress gaps often precede stream congestion or backpressure symptoms—pair with Monitor / Query on the same stream.
Tasks, sources, and sinks extend the same story: task rows expose mode, stream wiring, pool usage, and processing latency; connector rows expose class, enablement, events in/out, EPS, and last error for connector saturation and failure triage.
Runtime metrics
Use row metrics as live telemetry for throughput analysis and runtime troubleshooting:
| Signal | Production interpretation |
|---|---|
| EPS (avg / peak) | EPS collapse after a deploy often flags a failed pipeline slice, blocked stream, or silent connector; sustained low EPS vs peers hints stalled consumers or throttled ingress. |
| Events in / out / count | Throughput imbalance (ingress high, egress flat) suggests downstream congestion or an overloaded task; the inverse may indicate idle sinks or misrouted keys. |
| Dropped events | Abnormal drops plus flat EPS can mean buffer pressure or publish-side rejection; spikes during incidents deserve correlation with system telemetry and connector errors. |
| Avg processing (ms) (tasks) | Elevated latency with stable ingest points to overloaded tasks, hot partitions, or expensive PDL on the hot path. |
| Last error (connectors) | Shortcut to connector saturation, auth, or destination faults before log diving. |
Treat these as runtime metrics that complement—not replace—live event inspection and stream querying.
Querying stream data
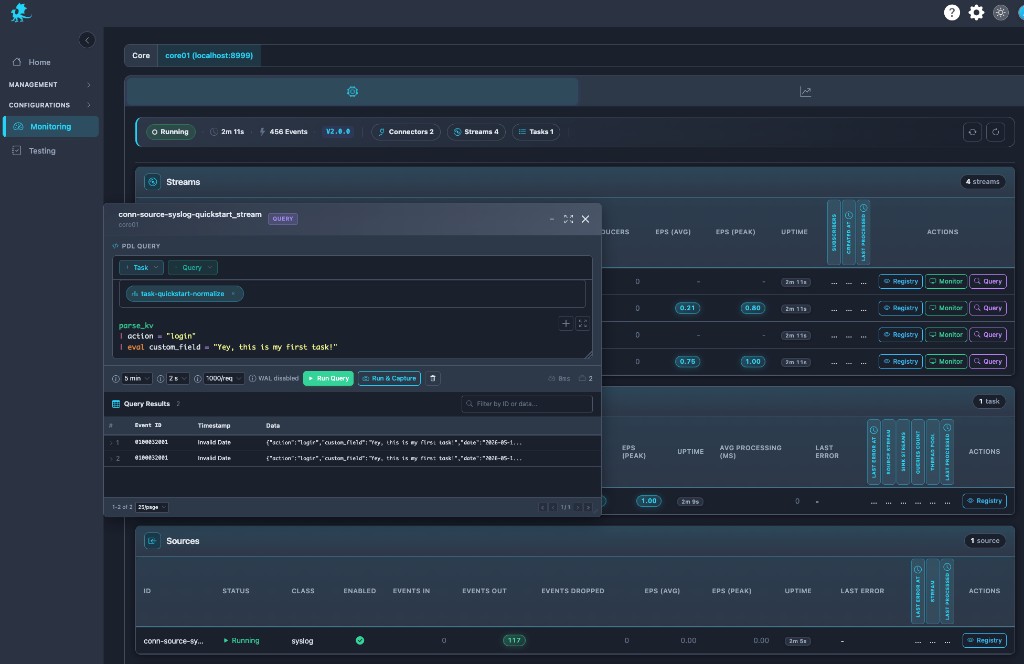
Query runs PDL directly against runtime stream data: the editor, time window, refresh cadence, and row limits target the selected stream’s live tail and, where retention allows, historical segments. That makes Query the fastest path for ad-hoc diagnostics during incidents—validate parsers, filters, and eval logic on real traffic without replay tooling.
| Control | When operators use it |
|---|---|
| Run Query | One-shot replay-style investigation over the configured window—ideal for proving a hypothesis on retained or sliding history. |
| Run & Capture | Sampling runs that retain result sets for tickets, comparisons, or follow-up—operational distinction: structured capture of query outcomes vs ephemeral scrolling. |
WAL-backed streams with retention may expose enough history for replay investigation of recent failures; in-memory or short-retention streams emphasize near-live behavior—see Streams for durability expectations.
Results surface as event id, timestamp, and JSON payloads so teams can confirm fields before touching registry definitions.
Syntax references: PDL Quick Reference, PDL Reference.
Live monitoring
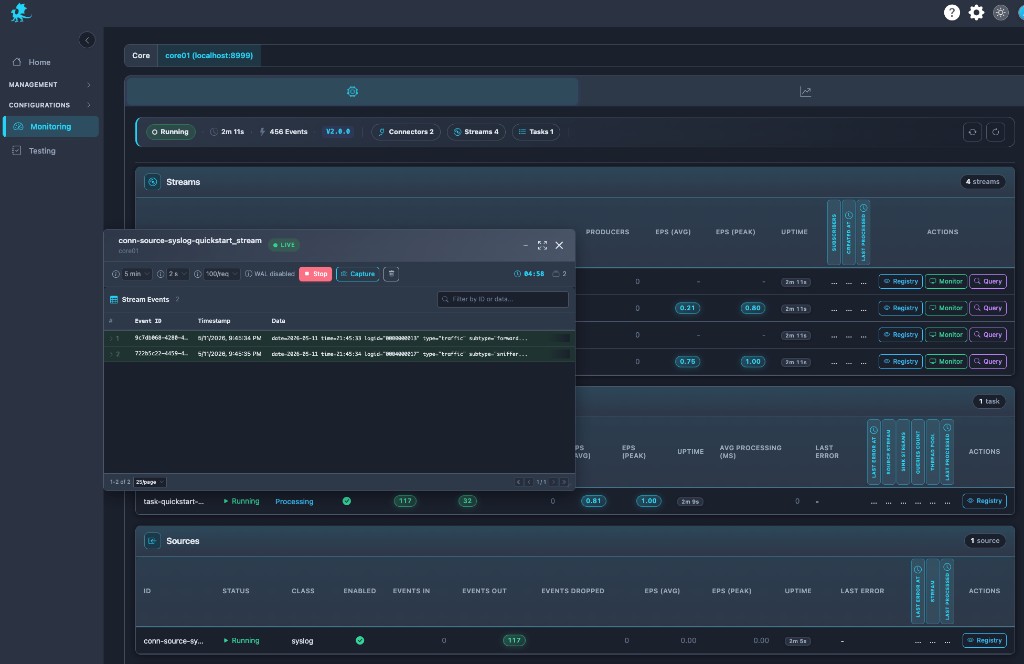
Monitor delivers near real-time event visibility: a LIVE feed with refresh intervals, limits, stop/start controls, and inline filtering so operators watch bytes-on-wire behavior during rollout validation or parser troubleshooting.
Capture from Monitor (or related controls) seeds Testing with replay datasets—freeze production-shaped events, then iterate PDL in the Testing workspace without mutating live pipeline execution. That connects live stream observability to runtime-safe experimentation; Testing remains its own validation surface, not a nested mode inside Monitoring.
Registry stream inspection
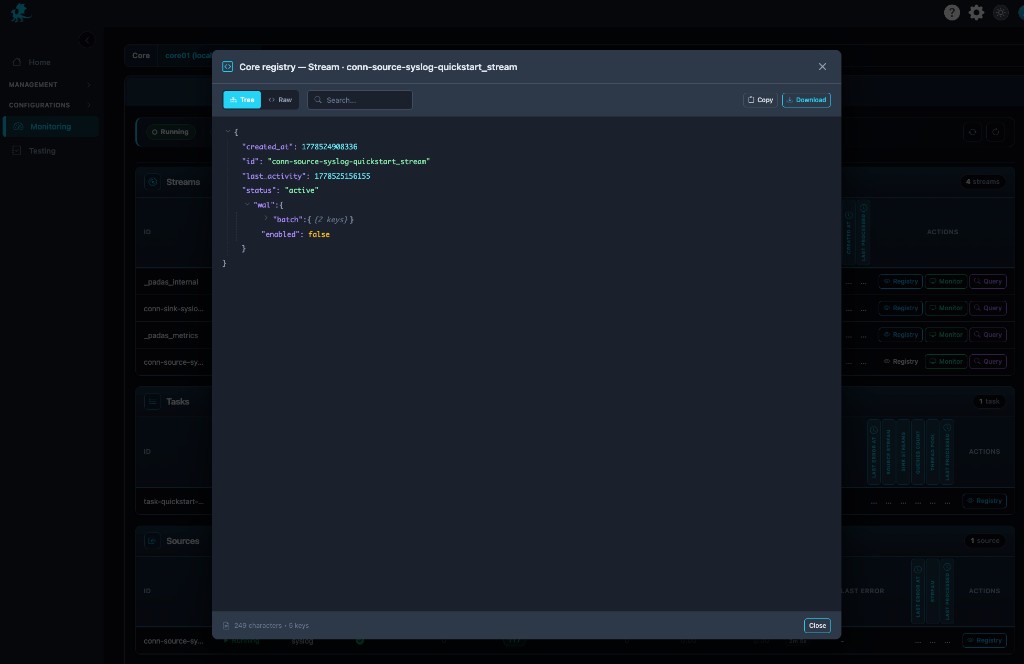
Registry opens runtime registry inspection for the stream row: canonical stream metadata—ids, status, activity timestamps, nested WAL configuration, and related fields—in tree or raw JSON, with search, copy, and download.
Use it when runtime behavior diverges from expectations: verify persistence flags, confirm WAL is enabled/disabled as designed, validate activity timestamps during deployment troubleshooting, or export evidence for change review. It complements Streams by showing what the engine currently materialized, not only what was authored.
System metrics
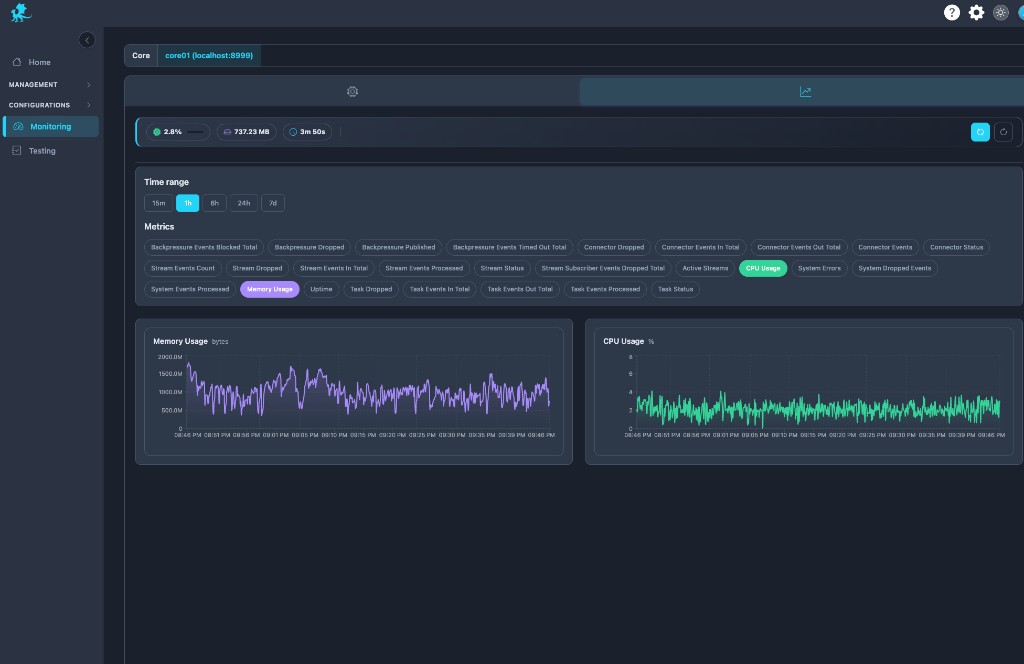
The metrics tab is the system telemetry dashboard for the same Core: preset windows (15m–7d), selectable series (CPU, memory, connector/stream/task counters, backpressure totals, processed/dropped aggregates), and synchronized charts for runtime stability analysis.
Operators correlate throughput dips with resource saturation, validate capacity after post-deploy regression windows, and tie stream congestion symptoms to host pressure or Runtime Engine resource limits. This is enterprise-grade observability layered on top of row-level pipeline diagnostics—not “CPU-only monitoring.”
External Prometheus scrape
The console charts above come from the UI’s local scrape history. External Prometheus, Grafana Agent, or VictoriaMetrics should scrape each Core directly:
GET https://<core-host>:8999/api/v1/metrics
Response is Prometheus text (Content-Type: text/plain). Series names follow the engine _padas_metrics contract (for example padas_stream_events_in_total, padas_task_events_out_total).
Authentication (S2S JWT)
After enrollment, the engine validates OAuth S2S JWTs (aud=padas-core). Do not use $PADAS_HOME/core/data/security/service-account.token for scrapers — that opaque file is legacy and returns 401 while S2S is active. Details: Security — Motion Engine API auth.
1. Create a reader client (recommended) — grant-ready credentials with core:read only, separate from Core enroll secrets:
- Services → Cores → Add reader client, or Settings → Service clients → Add client
- Enter a client ID (must not match a Core inventory id), copy the client secret once, download the install CA if needed, and use Copy example for Prometheus YAML
2. Mint a short-lived token from the console authorization server (default HTTPS :9000) with that reader client:
export PADAS_HOME=/opt/padas
UI=https://<ui-host>:9000
CORE=https://<core-host>:8999
CLIENT_ID=<reader-client-id>
CLIENT_SECRET=<secret-from-console-once>
CA="$PADAS_HOME/ui/data/security/install-ca.crt"

TOKEN=$(curl -sS --cacert "$CA" -X POST "$UI/api/v1/auth/token" \
  -H "Content-Type: application/x-www-form-urlencoded" \
  --data-urlencode "grant_type=client_credentials" \
  --data-urlencode "client_id=${CLIENT_ID}" \
  --data-urlencode "client_secret=${CLIENT_SECRET}" \
  --data-urlencode "aud=padas-core" \
  --data-urlencode "scope=core:read" \
  | python3 -c "import sys,json; print(json.load(sys.stdin).get('access_token',''))")

curl -sS --cacert "$CA" -H "Authorization: Bearer $TOKEN" \
  "$CORE/api/v1/metrics" | head
Expect 200 and lines starting with # HELP / # TYPE (or # No metrics available when the metrics stream is empty). Do not use the Core enroll secret or service-account.token for scrapers.
Legacy fallback: enrolled Core client secret (not recommended for Prometheus)
If you cannot use reader clients yet, you may mint with the enrolled Core client_id and host-stored secret — that credential carries write scopes and belongs on the Core host, not on a scraper. Prefer reader clients as soon as your console build includes them.
CLIENT_ID=<enrolled-core-client-id>
SECRET=$(sudo cat "$PADAS_HOME/core/data/security/${CLIENT_ID}.client.secret")
Then use the same token curl as above.
3. Configure Prometheus (native oauth2 scrape; Prometheus ≥ 2.27) so it refreshes tokens (static Bearer files go stale). The oauth2.tls_config block is Prometheus configuration for TLS to the token endpoint; job-level tls_config applies to the metrics scrape only — both typically use the install CA you downloaded from the console.
Set server.issuerUrl (console local-config.json) to the same <ui-host> Prometheus uses for token_url (reachable from the Prometheus host, not 127.0.0.1 unless Prometheus runs on the UI machine). The UI TLS certificate must match that host (SAN). S2S background: Security — Motion Engine API auth.
Example:
scrape_configs:
  - job_name: padas-core
    scheme: https
    metrics_path: /api/v1/metrics
    scrape_interval: 15s
    oauth2:
      client_id: "<reader-client-id>"
      client_secret: "<reader-client-secret>"
      token_url: "https://<ui-host>:9000/api/v1/auth/token"
      scopes: ["core:read"]
      endpoint_params:
        aud: "padas-core"
      tls_config:
        ca_file: /etc/prometheus/padas-install-ca.crt
    tls_config:
      ca_file: /etc/prometheus/padas-install-ca.crt
    static_configs:
      - targets: ["<core-host>:8999"]
        labels:
          core_id: "<core-id>"
When you use Copy example from the console after creating a reader client, static_configs is prefilled from Core inventory (host, port, and id per row). One - targets block per Core; edit hosts if scrapers reach Cores on a different address than the inventory host field.
Scrape each Core as its own target. Choose scrape_interval at least about 2× the engine metrics collection interval so PromQL rate() windows stay meaningful.
If token fetch fails with a hostname mismatch on the install CA, fix issuerUrl and the UI certificate SAN first; only as a last resort for lab debugging consider insecure_skip_verify: true under oauth2.tls_config and job tls_config (not recommended in production).
GET /api/v1/health, /ready, and /metrics skip JWT only for loopback clients (127.0.0.1 / ::1). Remote scrapers always need a JWT when S2S inbound auth is configured.
Troubleshooting workflows
Playbooks are maintained centrally in Troubleshooting & Logs → Monitoring and pipeline playbooks.
Monitoring is runtime-focused: it exposes live telemetry, event visibility, and stream diagnostics—it does not author registry objects or deploy topology. Make registry edits under Pipelines and assign/deploy under Management → Pipelines; use Control Tower for graph-level execution controls. Monitoring reflects runtime state, not intended topology alone.
Related pages
- Control Tower — live pipeline graph and graph-level runtime controls
- Testing — replay datasets, PDL validation, capture hand-off from Monitor
- Advanced — Tasks, sources & sinks — runtime start / stop on the selected Core
- Streams — WAL, retention, buffering definitions
- Tasks — task modes and stream wiring
- Pipelines — pipeline topology authoring
- REST API Reference —
/api/v1/*, runtime status, JWTcurlhelpers - Security — Motion Engine API auth — S2S JWT vs legacy service account
- PDL Quick Reference — Query editor syntax
- Core concepts — Observability — metrics and internal streams background
- Glossary — EPS, throughput, runtime diagnostics, internal stream terms